Privacy Geofencing

A question was posted yesterday on the Leaflet forum about doing geofencing with LeafletJS, so I posted this demo in response: http://exploringspatial.com/#demo/9.

Screen shot of privacy geofence demo

Privacy Geofence Demo

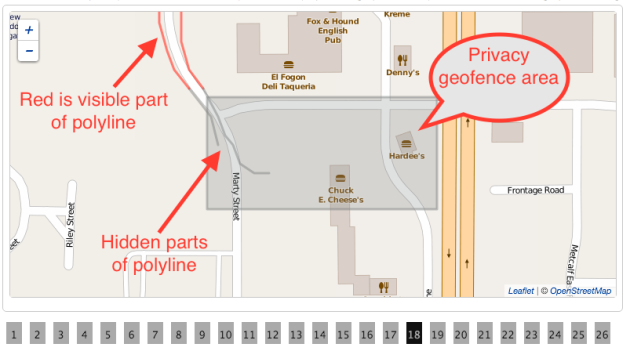
My demo scenario is that there is a user who likes to share her runs with friends on social media but doesn’t want everybody to see exactly where she lives, so she creates a privacy geofence around her house. The starting and ending sections of her run polyline are hidden once they enter the geofenced area. If the middle section of the run passes through the geofenced area it remains visible.

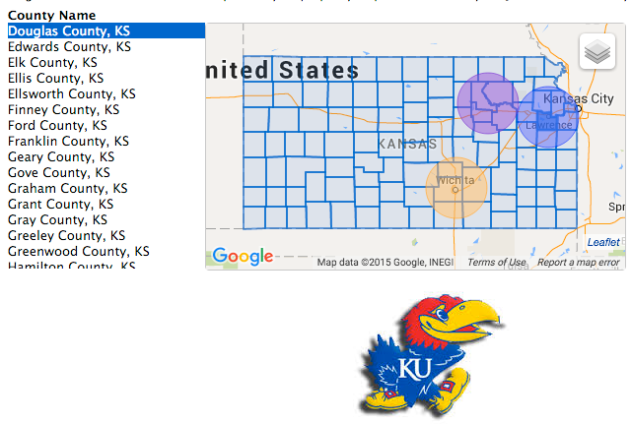
Here is a shout out to Roadrunners of Kansas City. The geofence boundary in this demo is around Sport+Spine, home-base to many of the Roadrunner runs. Thanks, Coach Amy!

For my example, I turned once again to the Leaflet-pip library, as I did for Demo7 and Demo 8. I use it a couple of different ways in this demo. First, I use it to locate runs for this demo whose start point falls within the demo’s privacy geofenced area. Second, when the user displays a run (by clicking the numbered buttons on the bottom of the page) I use Leaflet-pip again to test which points at the beginning and end of the run fall within the privacy geofence.

In the real world, you would always do the privacy filtering server-side, using something like GeoTools or spatial database queries, so that only the public sections of the polyline are exposed in the GeoJSON. I did this demo on the browser-side because my site is an Amazon S3-hosted static website, and also because the forum question was about doing geofencing with Leaflet.

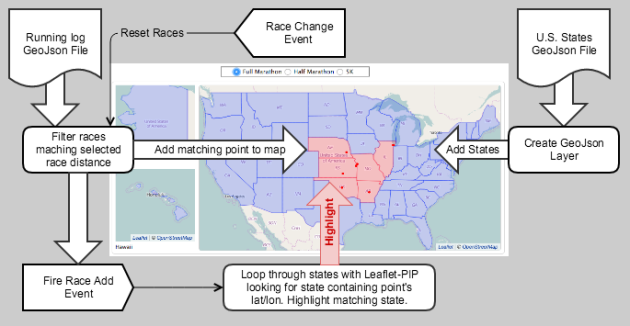
The code for this demo can all be found in RightSideView.js. The render method does the following things:

  1. Creates the L.featureGroup, geoFence, and adds a L.polygon defining the geofence boundaries.
  2. Displays the geofence on the map.
  3. Loads the running log GeoJSON file from Demo 5.
  4. Uses leafletPip.pointInLayer to find runs that start in the geofenced area, and then adds a paging div to the bottom of the page to open each matching run.
  5. Loads the first run.

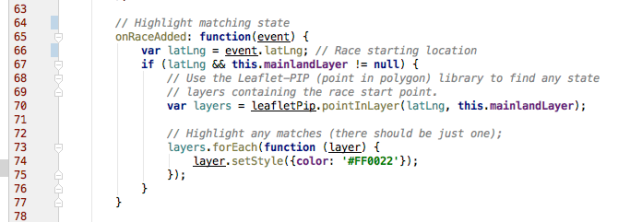
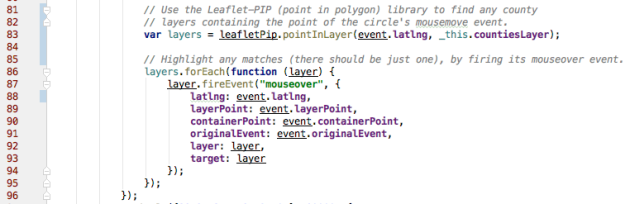
The interesting part of the code is in the onActivityFetched function. The “hidden” parts of the polyline are shown in gray on the map, so I needed to define three polylines: the hidden start, the visible middle, and the hidden end.

I loop through the polyline coordinates and add the points to the “fencedStart” array until I hit a point falling outside the geofenced area. After that, all points are added to a “middle” array.

Screen shot of the code to find the hidden start of the run.

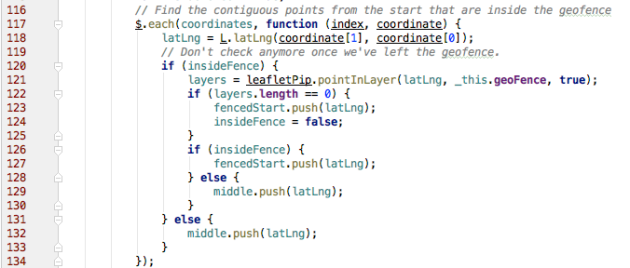
Find the Hidden Start of the Run and the Middle

Next, I loop backward over the points collected in the middle array looking for the points at the end of the run to be hidden.

Screen shot of the code to find the ending section of the run to be hidden.

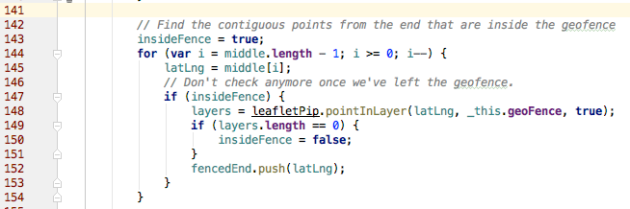
Find the End Section of the Run to Hide

Finally, now that I have the points to hide at the start and the end of the run, I just need to find the points in between to draw on the map in red.

Screen shot of code to find the middle of the run to add to map.

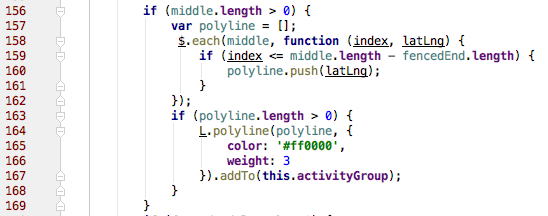
Find the Visible Section of the Run to Display on Map

Go to the demo and click on a few of the runs to see how it works. Doing this demo I learned that “Leaflet.PIP” (point-in-polygon), only works on polygons (go figure). I started out trying to use a L.circle for the geofenced area. That didn’t work.

The other shortcoming of this demo is that sometimes the first point outside the privacy geofence is some distance away, causing the visible line to stop short. That could easily be fixed with point projection along the bearing of the line between the two points that span the geofence boundary.

Happy Geofencing.


Browser-side Geospatial Maps

If you know many marathon runners, then you probably know somebody in the Fifty States Marathon Club, like my friend Jennifer. Here is a post from Jennifer on Facebook:

Map of states run

Jennifer’s 50-States Progress Report

What if users could simply use their electronic running log to generate progress maps on-the-fly? And, what if that map could be generated without increasing the load on expensive geospatial database servers?

That is exactly what I’m demonstrating today with Tom McWright‘s Leaflet-pip library. See it live here: http://exploringspatial.com/#demo/8. This demo reuses a personal running log GeoJSON file from demo 5. It combines my race data with a GeoJSON file containing shapes for the 50 states that I found at Frictionless Data.

The map flow is illustrated below. Keep in mind that I’m doing all of this with static files on my Amazon S3-hosted website.

states_map_flow

First, RightSideView.js downloads the running log GeoJSON file and the States GeoJSON file. It passes the states GeoJSON feature collection to StatesMapLayerView.js which loads it into three maps: the mainland, Alaska, and Hawaii.

Next, RacesMapLayerView.js loads the running log GeoJSON feature collection into a Leaflet GeoJson Layer filtering by eventType = “Race” and totalMeters equals the selected race distance. As each point is added to the map, MapEventDispatcher.js is used to publish a RACE_ADDED event.

The RACE_ADDED event triggers the State Map Layer View to call the Leaflet-pip library to find the state polygon containing the race point and change that state’s background color from blue to red.

Image of code used to find the race start point.

Find State Containing Race Start Point

Above the map is the race selector. It uses the Map Event Dispatcher to fire the RACE_SELECTED event. The RACE_SELECTED event triggers the State Map Layer View to remove all state highlighting. It also triggers the Race Map Layer View to re-filter the running log GeoJSON file using the updated race distance. That, in turn, fires RACE_ADDED again, which re-triggers state highlighting.

That’s it. Pretty simple. The geospatial matching to produce this map, that might have been done, say, in Oracle Spatial, is successfully offloaded to the customer’s web browser instead. This leaves expensive servers to do the large-scale geospatial operations they do best.


Breaking Dependence on Vendor Map APIs with Leaflet

A colleague had a question about porting a map written using Bing Maps AJAX 6.2 to Bing Maps AJAX V7. The existing map shows coverage areas that, when highlighted, highlight a corresponding item in a price list. The problem was that the mouse events didn’t work the same in the new version. I’ve become a bit of a Leaflet evangelist these days, so I showed them how to do it using Leaflet and the Leaflet-pip library instead. You can see the demo, pictured below, at this URL: http://exploringspatial.com/#demo/7. It’s a fun little interactive map.

Screenshot of Shape Event Demo

Screenshot of Shape Event Demo

I grabbed a GeoJSON file of Kansas counties from CivicDashboards for the shapes to be highlighted. There was also a requirement that hovering the mouse above overlapping shapes highlight all of the overlapping shapes, not just the top shape, so I added several large circles to my map representing Kansas universities. The list of county names to the left of the map is meant to represent the price list on my colleague’s map.

Hovering the mouse over a name in the list of counties highlights the corresponding county shape on the map and vice versa. Hovering over the university circles not only highlights the circle , but also the county shape underneath that circle.

The demo came together quickly since I was using Leaflet’s L.geoJson() layer for the county shapes, as I have done in several previous demos. There were just a couple of things that slowed me down: scrolling the list of county names to the highlighted name when hovering over a county shape on the map and propagating the mouse events to all overlapping shapes.

Scrolling Long Lists

Automatically scrolling to a highlighted name should have been easy, but it took me a bit to get it right. I worked up a proof-of-concept in JSFiddle first. You can find the POC code here: http://jsfiddle.net/stevecmitchell/5y1c3xsh/.  The code in my map demo is even shorter than my proof-of-concept on JSFiddle.

Propagating Mouse Events

I used mouseover and mouseout event handlers on the county shapes and college circles to handle highlighting. The problem was that when the circle received the mouse event the county underneath the circle did not receive an event, so it never got highlighted.

I posted a question to the Leaflet forum and was sent a solution in JSFiddle by user “ghybs”, https://github.com/ghybs, that used the leaflet-pip plugin. The leaflet-pip plugin was written by Tom McWright of Mapbox. It, in turn, credits an algorithm documented at Rensselaer Polytechnic Institute in Troy, NY.

Long story short, I added a mousemove listener to the college circles on the map. When the mouse moves over a circle the mousemove event handler uses leaflet-pip to find the county shape containing the point of the mouse event and then explicitly fires the mouseover event of the matching county shape.

Using leaflet-pip.pointInLayer

Using leaflet-pip.pointInLayer

I did not take the time to implement the event propagation the other direction. When you hover over a county name in the list, which highlights a county shape on the map, the college circle above it is not highlighted. This could be done… but I’ve invested enough time in this demo, so I didn’t do that.

I love this plugin. It is useful and easy to use. This gave me an idea for my next demo which will use leaflet-pip to demonstrate a “50-State Marathon Club” style map. You’ve seen them before. People who are trying to run a half or full marathon in all 50-states, or all seven continents, use them to track their progress.

The bulk of the code for this demo can be found here:

https://github.com/smitchell/exploringspatial/blob/master/js/views/maps/CountiesMapLayerView.js


How to Display Feature Collection GeoJson with Leaflet’s Marker Clusters

I enjoyed playing with Leaflet’s marker cluster plugin this weekend while writing a new demo, Demo 5, that shows how to load feature collection GeoJson into a Leaflet map layer.

Leaflet Marker ClusterIt was surprisingly easy to setup. First, I updated my GeoJson utility project to create feature collection GeoJson loaded with 768 of my runs from Garmin Connect. The features in the feature collection are summaries. They contain the same properties as the activity detail GeoJson from Demo 4, except that they use starting latitude/longitude instead of a polyline.   Next, I generated individual feature GeoJson files for each run with the full polyline. Finally, I added the new GeoJson files to my website at http://www.exploringspatial.com/activity/.

A Backbone Collection, Activities.js, uses AJAX to fetch the activity summaries. The collection is passed into the ActivitiesMapLayerView.js. The code in its render function is simple:

render: function() {
    var _self = this;
    geoJsonLayer = L.geoJson(this.collection.toJSON(),{
        onEachFeature: _self.onEachFeature
    });
    this.map.fitBounds(geojson.getBounds());
    this.activitiesLayer = L.markerClusterGroup();
    this.activitiesLayer.addLayer(geoJsonLayer);
    this.map.addLayer(this.activitiesLayer);
    this.map.on('popupopen', function(event) {_self.onPopupOpen(event);});
    $('.returnToSearch').on('click', '.returnTrigger', function(event){
        _self.onReturnToSearch(event)
      });
}
  1. L.geoJson – Create a map layer by passing in the activity collection JSON along with a onEachFeature function (see below).
  2. L.markerClusterGroup – Create a marker cluster map layer.
  3. addLayer – Add the GeoJson layer to the marker cluster group.
  4. addLayer – Add the marker cluster group to the map.

The last two lines of code bind a listener to the popupopen event, and add a listener for the activity detail page event that returns to the main page.

The onEachFeature function is used to bind a popup to each feature marker on the map. It does some date and number formatting and then passes HTML into layer.bindPopup.

onEachFeature: function(feature, layer) {
    var date = new Date(feature.properties.startTime);
    var triggerId = feature.properties.activityId;
    var msg = [];
    msg.push(feature.properties.name);
    msg.push('Start: ' + date.toLocaleDateString() + ' ' + date.toLocaleTimeString() + '');
    var dist = Math.round((feature.properties.totalMeters * 0.000621371)*100)/100;
    msg.push('Dist: ' + dist + ' mi');
    msg.push('Go to Activity');
    layer.bindPopup(msg.join(''), {maxWidth: 200});
},

The interesting bit happens in the onOpenActivity and renderActivity functions when a user clicks the “Go to Activity” anchor in the popup. The onOpenActivity function instantiates an Activity Backbone model and invokes its fetch function to go get the polyline for the selected activity id. The renderActivity function is passed in the success property of the AJAX call.

onOpenActivity: function(event, popup) {
    var location = popup._latlng;
    this.map.closePopup(popup);
    // Capture the current center and zoom to restore map later
    this.originalCenter = this.map.getCenter();
    this.originalZoom = this.map.getZoom();
    this.activity = new Activity({activityId: event.target.id});
    var _this = this;
    this.activity.fetch({
        success: function () {
        _this.renderActivity();
    }
});
        },

When the polyline is successfully returned from the server the renderActivity function creates a new activity map layer to swap with the marker cluster map layer. A feature GeoJson map layer is added to the map, along with the start and end markers.

renderActivity: function() {
    $('.returnToSearch').show();
    if (this.map.hasLayer(this.activitiesLayer)) {
        this.map.removeLayer(this.activitiesLayer);
    }
    var props = this.activity.get('properties');
    this.map.fitBounds([
        [props.get('minLat'), props.get('minLon')],
        [props.get('maxLat'), props.get('maxLon')]
    ]);
    var style = {
        color: '#FF0000',
        weight: 3,
        opacity: 0.6
    };
    this.activityLayer = L.geoJson(this.activity.toJSON(), 
        {style: style}).addTo(this.map);
    var polyline = this.activity.get('geometry').get('coordinates');
    var startPoint = polyline[0];
    var endPoint = polyline[polyline.length - 1];
    this.activityStart = L.marker([startPoint[1], startPoint[0]], 
        {icon: this.startIcon}).addTo(this.map);
    this.activityEnd = L.marker([endPoint[1], endPoint[0]], 
        {icon: this.endIcon}).addTo(this.map);
},

Once the user clicks Back to Search, this is the block of code that restores the marker cluster layer. The activity feature layer, start, and end markers are removed (not shown), and then the marker cluster layer is added back to the map and the original center and zoom are restored.

 this.map.addLayer(this.activitiesLayer);
 if (this.originalCenter != null && this.originalZoom != null) {
    this.map.setView(this.originalCenter, this.originalZoom, {animate: true});
    this.originalCenter = null;
    this.originalZoom = null;
 }

That’s it! Be sure to go to the demo, http://www.exploringspatial.com/#demo/5, and click around.

Rendering a GeoJSON layer in Leaflet

The addition of a GeoJSON layer showing a Garmin activity polyline completes my example of using Leaflet with Bing, Google, and OSM base layers.

Static GeoJSON Leaflet map with Google, Bing and OSM base layers.

Static GeoJSON Leaflet map with Google, Bing and OSM base layers.

I did a lot of work to get to this point. Some tasks were completely unrelated to the demo, like converting my website to a single-page Backbone application. Other tasks were behind the scenes, like writing a utility to convert Garmin FIT files into GeoJSON. A great deal of my time was spent recreating the Garmin-style map controls to switch between Google, Bing, and OSM. Eventually, I want to add the Google bicycle path layer and fix a bug I found today on the menu controls, but that can wait.

Once I was ready to add the polyline and custom pin icons, coding was a breeze. All that needed to be done was to extend L.Icon for the custom pin icons and drop the polyline GeoJSON into the L.geoJson function as shown below:

    var ActivityMapLayerView = Backbone.View.extend({

        initialize: function(args) {
            this.map = args.map;
            var CustomIcon = L.Icon.extend({options: {
                iconSize: [33, 50],
                iconAnchor: [16, 49]
            }});
            this.startIcon = new CustomIcon({iconUrl: 'media/pin_start.png'});
            this.endIcon = new CustomIcon({iconUrl: 'media/pin_end.png'});
            this.render();
        },

        render: function() {
            var props = this.model.get('properties');
            this.map.fitBounds([
                [props.get('minLat'), props.get('minLon')],
                [props.get('maxLat'), props.get('maxLon')]
            ]);
            var style = {
                color: '#FF0000',
                weight: 3,
                opacity: 0.6
            };
            L.geoJson(this.model.toJSON(), {style: style}).addTo(this.map);
            var polyline = this.model.get('geometry').get('coordinates');
            var startPoint = polyline[0];
            var endPoint = polyline[polyline.length - 1];
            L.marker([startPoint[1], startPoint[0]], {icon: this.startIcon}).addTo(this.map);
            L.marker([endPoint[1], endPoint[0]], {icon: this.endIcon}).addTo(this.map);
        }

    });

The GeoJSON is passed into L.geoJson along with style properties to control the color, weight, and opacity of the polyline. That is all it took!

Now it is time to being exploring the plethora of Leaflet plugins supporting interactive maps. I’m looking forward to getting started.

Converting Garmin FIT activities into GeoJSON

My demo accomplished what I wanted to do with Leaflet regarding Bing, OSM, and Google base maps. The demo is at http://www.exploringspatial.com/#demo/4. The only base map plumbing that remains is to figure out how to add Google’s bicycle path layer.

The next step is to display the activity polyline as a Leaflet layer instead of adding it directly to Google, Bing, or OSM maps via the vendors’ map APIs. With Leaflet, the base map is simply the background for the vector graphics displayed on a Leaflet map layer in the foreground.

Using GeoJSON with Leaflet

First, I needed to produce GeoJSON as described here: http://leafletjs.com/examples/geojson.html. GeoJSON is a JSON standard for geometry types (see http://geojson.org). The geometry types are:

  • Point
  • LineString
  • Polygon
  • MultiPoint
  • MultiLineString
  • MultiPolygon

Geometry types may be combined with additional properties using Feature or FeatureCollection. Leaflet has a map layer type that can consume Feature JSON or FeatureCollection JSON.

Garmin Activity FIT File in –> GeoJSON out

Modern Garmin fitness devices store data in a compressed binary format called the FIT protocol (see http://thisisant.com).

My first task was to create a utility to read Garmin activity FIT files and produce Feature GeoJSON. The code is on GitHub: https://github.com/smitchell/garmin-fit-geojson.

I used my 2012 Little Rock Marathon activity to test the GeoJSON utility. The FIT SDK decodes the activity FIT file. The GeoTools FeatureJSON class outputs the GeoJSON.

There are two steps to creating GeoJSON using the GeoTools API:

  1. Define a feature type (schema) for the feature properties.
  2. Build the feature following the feature type definition.

Defining a Simple Feature Type

The SimpleFeatureTypeBuilder class is used to layout the schema for the Feature.

public SimpleFeatureType getFeatureSchema() {
    final SimpleFeatureTypeBuilder simpleFeatureType = new SimpleFeatureTypeBuilder();
    simpleFeatureType.add("geom", LineString.class, DefaultGeographicCRS.WGS84);
    simpleFeatureType.add("name", String.class);
    simpleFeatureType.add("activityId", Long.class);
    simpleFeatureType.setName("activity");
    simpleFeatureType.add("activityName", String.class);
    simpleFeatureType.add("sport", String.class);
    simpleFeatureType.add("startTime", String.class);
    simpleFeatureType.add("totalMeters", Double.class);
    simpleFeatureType.add("totalSeconds", Double.class);
    simpleFeatureType.add("minLat", Double.class);
    simpleFeatureType.add("minLon", Double.class);
    simpleFeatureType.add("maxLat", Double.class);
    simpleFeatureType.add("maxLon", Double.class);
    return simpleFeatureType.buildFeatureType();
}

Building the Feature

The SimpleFeatureBuilder builds the SimpleFeature following the feature schema definition.

public SimpleFeature buildSimpleFeature(final FitActivity fitActivity) {
    final SimpleFeatureType featureSchema = getFeatureSchema();
    final SimpleFeatureBuilder builder = new SimpleFeatureBuilder(featureSchema);
    builder.set("activityId", fitActivity.getActivityId());
    builder.set("sport", fitActivity.getSport());
    builder.set("startTime", fitActivity.getStartTime());
    builder.set("totalMeters", fitActivity.getTotalMeters());
    builder.set("totalSeconds", fitActivity.getTotalSeconds());
    final Coordinate[] polyline = fitActivity.getPolyline().toArray(
        new Coordinate[fitActivity.getPolyline().size()]);
    final Geometry geometry = simplifyLineString(polyline);
    builder.add(geometry);
    final Coordinate[] boundingBox = generateBoundingBox(geometry);
    builder.set("minLat", boundingBox[0].y);
    builder.set("minLon", boundingBox[0].x);
    builder.set("maxLat", boundingBox[1].y);
    builder.set("maxLon", boundingBox[1].x);
    return builder.buildFeature("0");
}

The final result, formatted for readability, can be found here: http://www.exploringspatial.com/feature.json

This is a partial listing:

{
  "type": "Feature",
  "geometry": {
    "type": "LineString",
    "coordinates": [
      [
        -92.2639,
        34.7473
      ],

... many points omitted.

      [
        -92.2668,
        34.7484
      ]
    ]
  },
  "properties": {
    "activityId": 155155867,
    "sport": "RUNNING",
    "startTime": "2012-03-04T14:02Z",
    "totalMeters": 42453.58984375,
    "totalSeconds": 15162.140625,
    "minLat": 34.73176879808307,
    "minLon": -92.34434505924582,
    "maxLat": 34.78602569550276,
    "maxLon": -92.25817699916661
  },
  "id": "0"
}

Now I’m ready to create a Leaflet GeoJSON layer to display the polyline!

2014 Location Intelligence Conference Report

Screenshot from 2014-05-23 15:18:18

The Location Intelligence conference in Washington, D.C. this week reinvigorated me. Tim Gerber, my database administrator/coworker, and I gave a presentation, How Garmin Connect Manages and Analyzes 5-billion Miles of User Activities , and we attended some very informative sessions.

It was exciting to meet both authors of Applying and Extending Oracle Spatial, Siva Ravada, and Simon Greener. You may know Simon from his website spatialdbadvisor.com.

Dan Geringer, who has been an invaluable spatial resource to Garmin, arranged a meeting for Tim and me with LJ Qian from Oracle’s Map Viewer team and Jayant Sharma, an Oracle Spatial Product Manager. We talked at length about generating dynamic heat maps from Oracle Spatial data, and we discussed using Oracle Map Viewer as an abstraction layer above base maps from Google, OSM, and other providers. I also enjoyed visiting with Oracle Product Manager, Jean Ihm.

My top priority coming out of the conference is to see if I can do with the Oracle Map Viewer HTML5 map client what I had hoped to accomplish with Leaflet. I want to separate our map code, line and point interaction, from the base map provider selected by the user, so that we can reduce the code written specifically for Google, Bing, OSM, and Baidu maps.

Since returning home I’ve been trying to find a Linux distro that runs well under Oracle VirtualBox to use as my test environment for Oracle SQL Developer, Oracle MapViewer quick start, and possibly Oracle WebLogic. Ubuntu 14.04 did poorly due to an issue with Unity 3D. Fedora 20 also seemed slow. OpenSUSE 13.1 looks promising, but I’m not far enough along in the set-up know for sure.

Exploring Leaflet Raster Classes

leaflet

Below is the class diagram for the Leaflet raster classes. As I prepared this diagram I realized it did not go far enough for me since I don’t have experience working the raster images. I’m going to put my exploration of Leaflet classes on hold and take a detour into the world of raster graphics.

Leaflet Raster Classes

Leaflet Raster Classes

I found several posts on Google map tilesBing map tiles, and OSM map tiles. The article on OSM map tiles referenced the Slippy Map Tile Application, and Mapnik, an open source tool for rendering maps.

If I start with Mapnik I need some raster tiles to render, don’t I? This would be the perfect time to continue my post from June about working with satellite images with TileMill. In that post I installed the following tools on my computer:

  1. GDAL, a low-level GIS toolkit
  2. libgeotiff, to work with geotags
  3. ImageMagick, an image processing package
  4. TileMill, an open-source mapmaking app from Mapbox

For my next post, I’ll pick up where I left off and follow the article Processing Landsat 8 Using Open-Source Tools by Charlie Loyd. Then perhaps I’ll look at GMap Creator and MapTiler. I’m open to suggestions for good raster learning resources.

When I’m done I’ll revisit this Leaflet raster class diagram again.

Exploring Leaflet Vector Classes

leaflet

This post, third in my series on the Leaflet API, explores the vector classes. Vector graphics are primitive geometric shapes that easily scale across pixel resolutions, such as points, lines, circles, and polygons. The point class, L.LatLon was covered in my previous post, Exploring Leaflet Geographic Classes. The remaining vector classes are shown below.

Leaflet Vector Classes

Leaflet Vector Classes

As was the case with the geographic classes, there are similar vector classes available in all online map APIs.

Not pictured above are L.MultiPolyline and L.MultiPolygon, as those are contained in L.FeatureGroup, which extends L.LayerGroup, which I will covered later in my series. I included L.PolyUtil and L.LineUtil because they have some helpful functions, such as Douglas-Peuker line simplification, distance and proximity calculations, and clipping.

A picture is worth a 1,000 words, so I’m not going to expand on my diagram. You can read more in the Leaflet API documentation.

Next stop, raster classes.

Exploring Leaflet Geographic Classes

leaflet

In my previous post, Exploring Leaflet Base Classes, I covered the core classes upon which the Leaflet API is built. In this post, I cover the geographic classes.

If you have ever used the APIs for Google, Bing, OSM, or Open Layers then you are already familiar with the model objects for the spherical reference system: latitude and longitude, as well as for the 2-D projection, point, expressed as x/y coordinates. The corresponding classes for Google are LatLng, LatLngBounds, and Point. For Bing Maps the classes are Location, LocationRect, and Point. OSM uses LatLng, RectLL, and Point. Leaflet has LatLng, LatLngBounds, Point, and Bounds, as illustrated below.

Leaflet Geographic Classes

Leaflet Geographic Classes

The diagram above also includes the L.Map class showing its functions that either accepts or return the other classes shown on the diagram. You’ll note that many map features, such as responding to events, are available in both Lat/Lon or x/y point versions. Also, note the many projection functions on L.Map that depend on the projection system specified for a given map instance.

Every web mapping API must project coordinates from a spherical reference system, latitude, and longitude, to the 2-D, x/y pixel coordinates on your computer monitor. In most online maps, like Google Maps, the projection system is fixed because the vendor controls both the base map and vector layer. Leaflet and OpenLayers, on the other hand, are open, so the user is free to pick base maps generated with a different coordinate reference system. Matching the projection system ensures that features on the vector layer align with the base map tiles. The Leaflet CRS classes are shown below.

leaflet_crs_classes

Leaflet CRS Classes

I found a good post about spherical Mercator projections on the Open Layers web site. Lucky for me, at Garmin Connect all of our base maps, Google, Bing, and OSM, use Spherical Mercator so I won’t have to mess with the projection system.

In my next post, I’ll delve into vector layer classes.